Global growth of wind needs to be double as fast as recent growth in Germany to meet IEA’s Net Zero by 2050
The IEA's Net Zero by 2050 Roadmap for the Global Energy Sector envisions adding 310 GW of onshore wind every year by 2030. How does this compare with the recent growth of wind power?
To answer this question, we first need to relate the wind power growth to the world of 2030, which would have more people and a larger economy. It would make most sense to normalise capacity additions to the total amount of electricity generated, because the size of the electricity market determines resources available for investments into new capacity. The Net Zero Roadmap projects some 32 000 TWh of electricity to be generated in 2030 and thus the wind capacity additions can be recalculated to ca 10 MW per each TWh of the total electricity generation.
In the last five years (2016-2020), almost the same onshore wind capacity (294GW) has been added as the Net Zero Roadmap requires to be added in one year in 2030. However, the global electricity generation today is smaller (about 25 000 TWh). Normalised to this smaller system, wind capacity additions translate into ca 2.5 MW per TWh. In other words, onshore wind needs to grow ca 4 times faster to be in line with Net Zero by 2050.
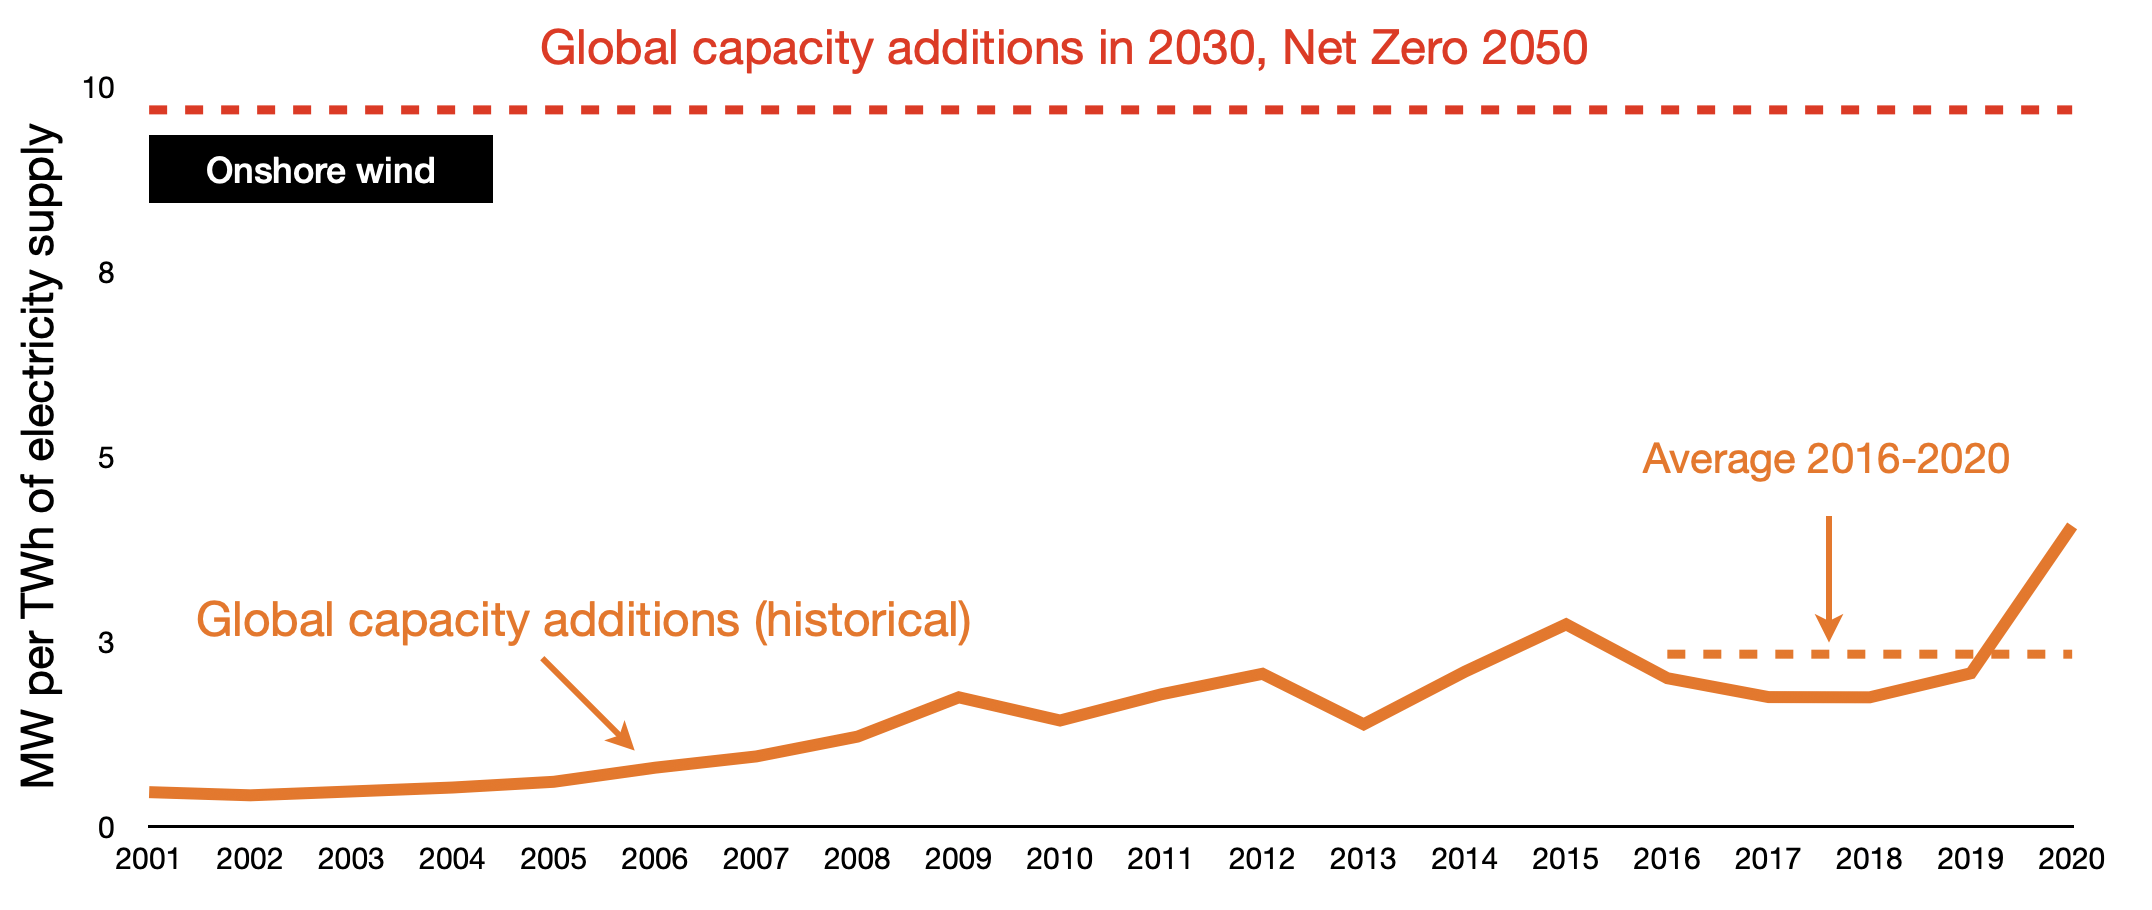
Global onshore wind capacity additions in the Net Zero 2050 scenario (IEA 2021) and historically in 2001-2020
Has any country ever achieved such growth?
Germany is the world leader in onshore wind. In 2017, it added 4.9GW of capacity while generating ca 600 TWh electricity, i.e. ca 8.2 MW per TWh of the total generation. So if by 2030 the whole world performs like Germany in 2017, it will be almost on track to the the Net Zero.
However, 2017 was the peak year for onshore wind growth in Germany.
In 2016-20 Germany added on average 2.6 GW/year of onshore wind and in 2021-30 it plans to auction of up to 4 GW/year. This corresponds to 4.4 and 6.7 MW per TWh of electricity supply respectively (if the auctions will be fully used, which was not the case in recent years). Thus, being on track to Net Zero by 2050 really requires that the world as a whole is 2.3 times faster than Germany in the last five years and some 1.5 times faster than Germany plans to be in the next decade.

Global onshore wind capacity additions in 2030 (IEA Net Zero 2050) and in 2001-2020 as well as in Germany in 2001-20 and auction corridor for 2022-2030
China's peak in 2020 (9.3 MW) is somewhat higher than Germany’s 2017 peak (8.2 MW) and its 2016-20 average (4 MW) is somewhat smaller than Germany’s (4.4 MW). Other large leaders lag behind:
Spain – 10.5 MW at peak (2007), 2.9 MW on average (2016-20);
UK – 5 MW at peak (2017), 2.9 MW on average (2016-20);
USA – 3.5 MW at peak (2020), 2.1 MW on average (2016-20)
(all capacity additions are normalised per TWh of the total electricity generation).
Portugal sets a record for smaller countries with peak capacity additions of 12 MW per TWh of supply in 2008, though the average for 2016-20 is only 1 MW per TWh of electricity produced, ten times less than what every country needs to do in 2030 to stay on the Net Zero 2050 Roadmap.